Build a Social Media Analytics Report That Stands Audit
13 min readsocial media analytics reportsocial media reportingKPI trackingcontent strategy

The request arrives at 4:30 p.m. A stakeholder wants to know which social channels influenced pipeline, why reported conversions don't match the CRM, and whether the latest campaign deserves more budget. Your dashboard looks polished. It has reach, impressions, engagement, follower growth, and a rising line chart. Then someone asks where each number came from, which conversions were duplicated, and what happened after the click. The visual polish stops helping.
A useful social media analytics report has to do more than summarize platform activity. It must connect a business objective to defined metrics, trace those metrics back to source data, and separate observed attribution from actual commercial impact. That standard changes how you collect exports, compare networks, label uncertainty, and write recommendations.
Table of Contents
- The Audit-Ready Reporting Gap
- The Six-Stage Measurement Chain
- Platform-Specific KPI Frameworks
- Data Collection and Deduplication Workflows
- Attribution Transparency and Confidence Levels
- Deriving Timing and Content Recommendations
- From Data Collector to Strategic Advisor
The Audit-Ready Reporting Gap
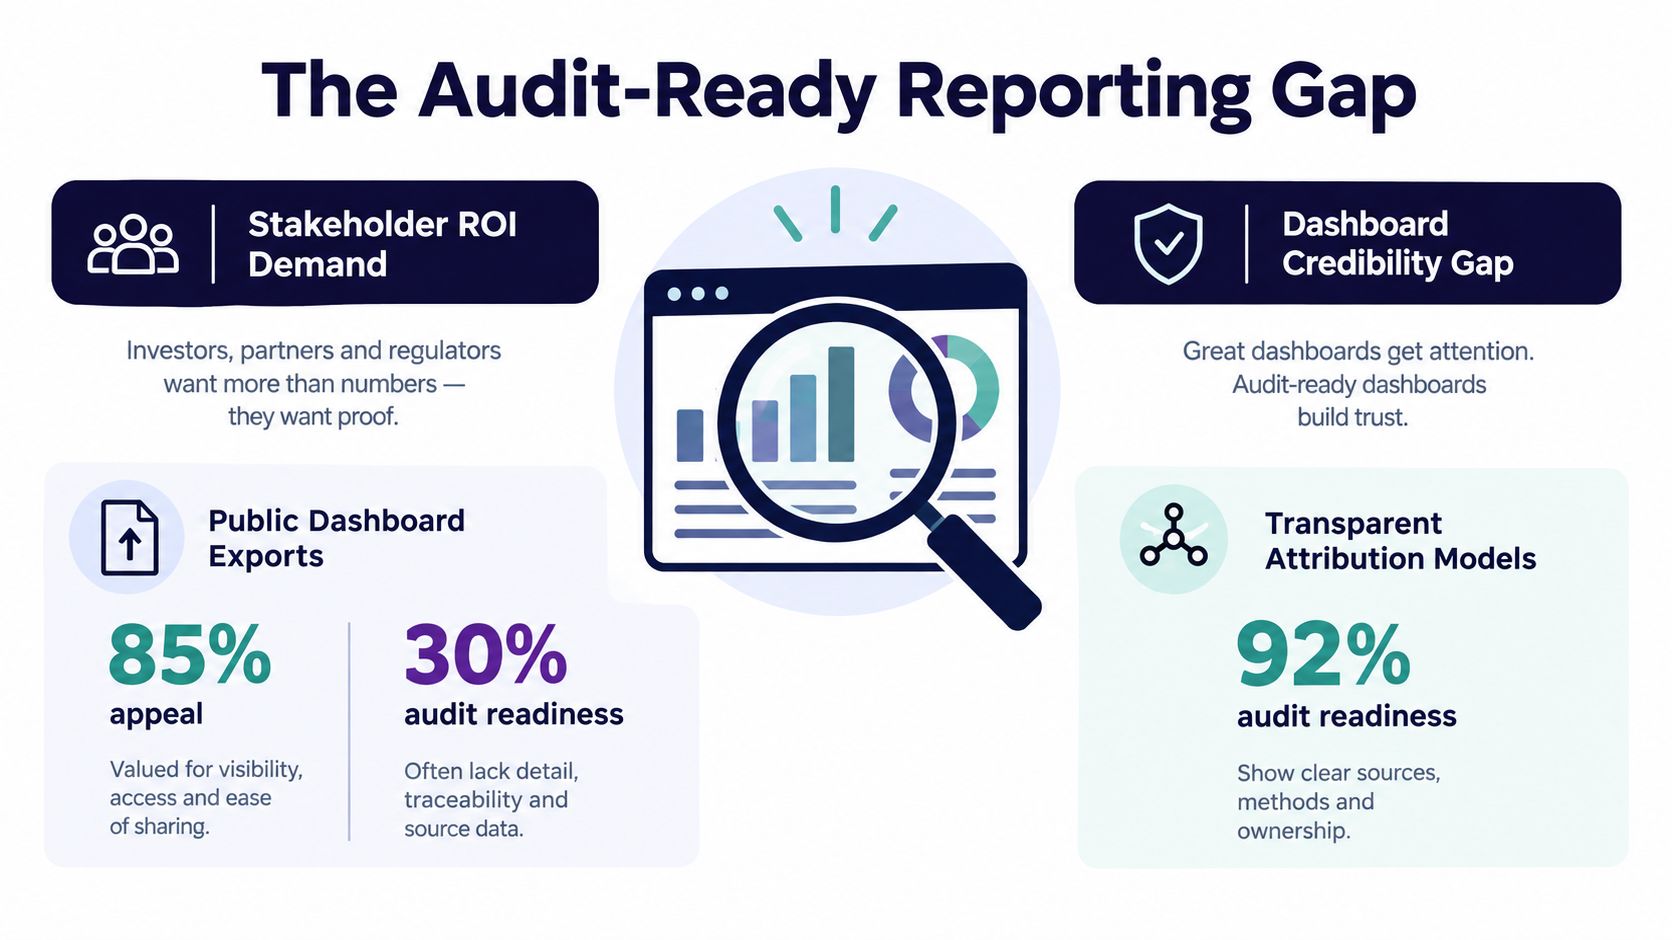
A platform dashboard is designed for operating a channel, not defending a measurement system. Meta, LinkedIn, TikTok, YouTube, and other networks calculate metrics with different definitions, attribution windows, time zones, and audience rules. Their native views can answer whether a post generated reactions or whether a campaign received clicks, but they rarely provide a complete explanation of how social exposure relates to qualified leads, sales, retention, or assisted conversions.
The first failure usually comes from treating attention as evidence of value. Impressions and reach describe distribution. Likes, comments, saves, and shares describe reactions. Neither category proves that a buyer became more likely to purchase, and a large audience can include duplicated people across several platforms.
Why a single-network view breaks
DataReportal reported 5.24 billion active social media user identities worldwide in 2025, with 4.1% growth over the preceding 12 months. Social media adoption reached 94.2% of internet users, and 97.3% of connected adults used at least one social network or messaging platform each month. The same source reports that the average internet-connected adult used 6.83 social platforms monthly, which makes a single-network total an incomplete view of audience behavior. DataReportal's 2025 social media analysis
That scale creates a reconciliation problem. One person may see a video on TikTok, click a retargeting ad on Facebook, read a LinkedIn post, and later convert through branded search. If the report adds each platform's claimed conversion, it can produce a total larger than the actual number of sales.
Audit principle: A credible report preserves platform context while creating one documented view of campaigns, people, events, and outcomes.
Before building charts, define the source for every field, the time zone used for aggregation, the distinction between paid and organic activity, and the rule for removing duplicates. A structured SEO reporting tool can support repeatable reporting workflows, but no tool can repair undefined formulas or conflicting attribution rules. The methodology has to be explicit first.
The Six-Stage Measurement Chain
An audit-ready report follows a chain. If one link is missing, the final recommendation becomes difficult to defend.
Start with the decision
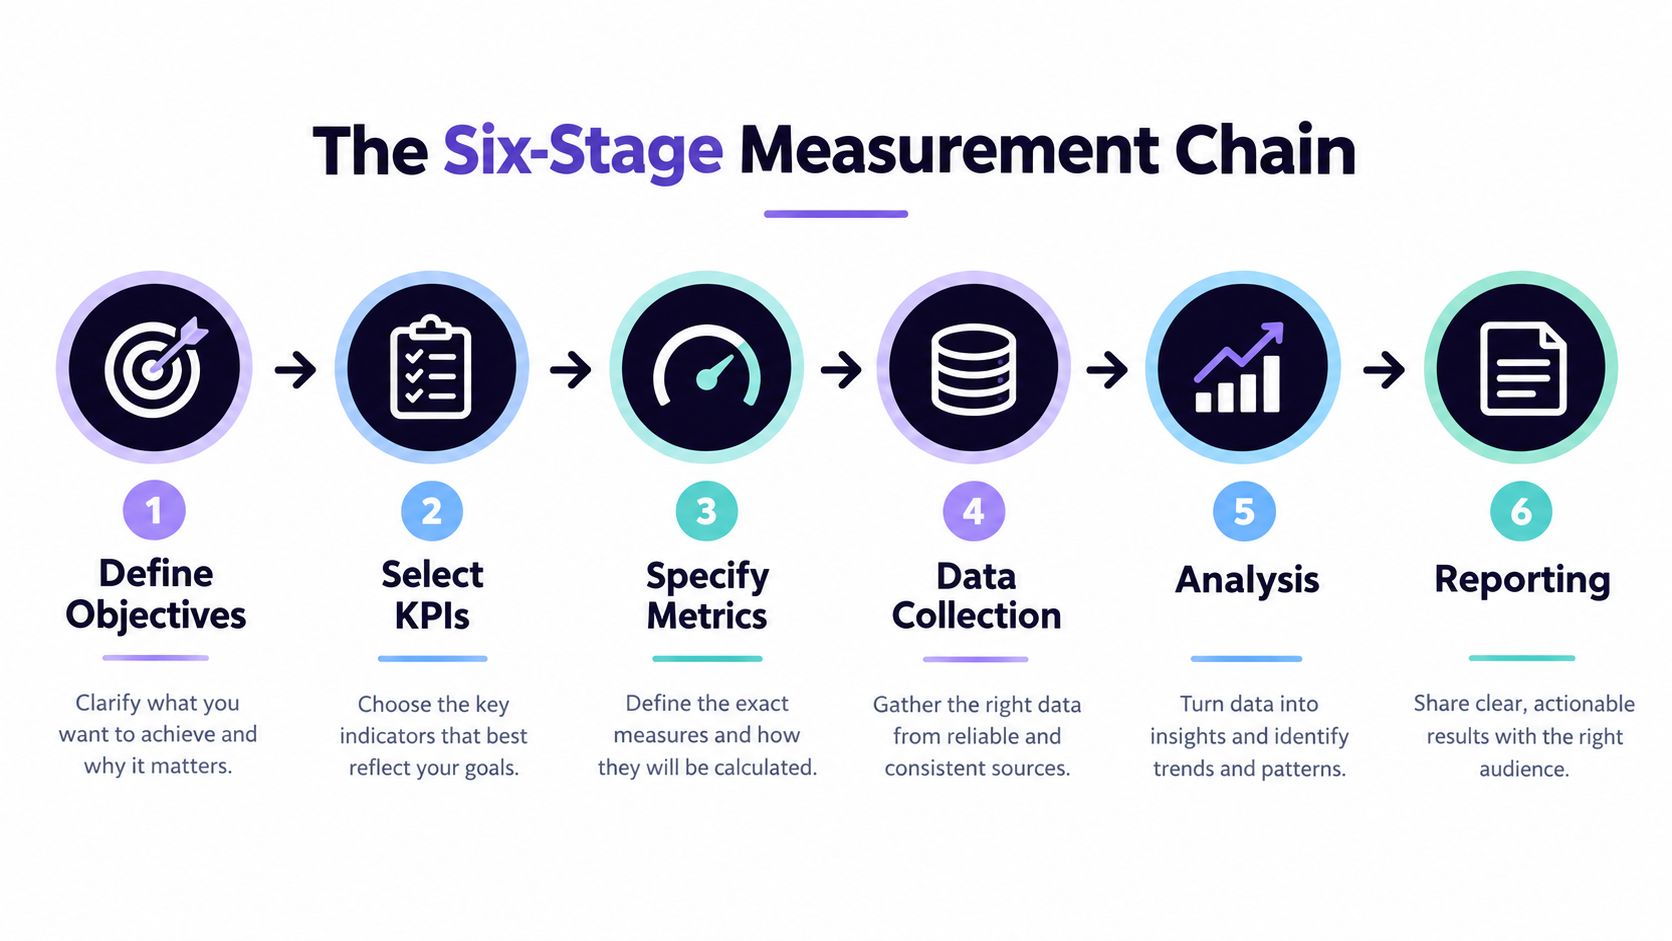
1. Define the objective. Begin with the management question, not the metric list. The objective might be qualified traffic, lead generation, community participation, retention, or campaign efficiency. “Increase engagement” can be a useful intermediate aim, but it isn't a substitute for a business outcome when the campaign is meant to generate demand.
2. Select KPIs. Assign three to five KPIs to each funnel stage, then identify one primary KPI and a limited set of diagnostic measures. For a lead-generation campaign, qualified leads may be primary, while landing-page sessions, form completion, and cost per qualified lead explain movement without replacing the outcome.
3. Specify operational metrics. Write the formula, numerator, denominator, scope, and source. A reach-based engagement rate is more suitable for comparing posts with materially different distribution than a follower-based rate, while link clicks and conversions should remain separate measures.
Make the chain reproducible
4. Collect data. Export account-level platform data, website analytics, campaign metadata, and CRM outcomes. Preserve the original files, extraction dates, reporting periods, and filters.
5. Analyze performance. Reconcile timestamps and campaign names, remove duplicated posts, separate paid from organic activity, calculate rates from raw counts, and segment results by network, content format, audience, and content pillar. Inspect outliers rather than allowing one viral post to define the period.
6. Convert findings into decisions. Every conclusion should answer what changes next, who owns the action, and which KPI will determine whether the change worked. A report that only describes the past is a record, not a management instrument.
A campaign plan should carry the same naming conventions as the report. Teams that align launch dates, content labels, UTM fields, and ownership early can avoid rebuilding the dataset at the end of the campaign. The campaign planning workflow is useful as an operational reference because measurement becomes easier when planning metadata is consistent from the beginning.
The practical test is simple. Give another analyst the source exports, definitions, and calculation sheet. If they can't reproduce the headline figures without asking the original report author what happened, the chain isn't complete.
Platform-Specific KPI Frameworks
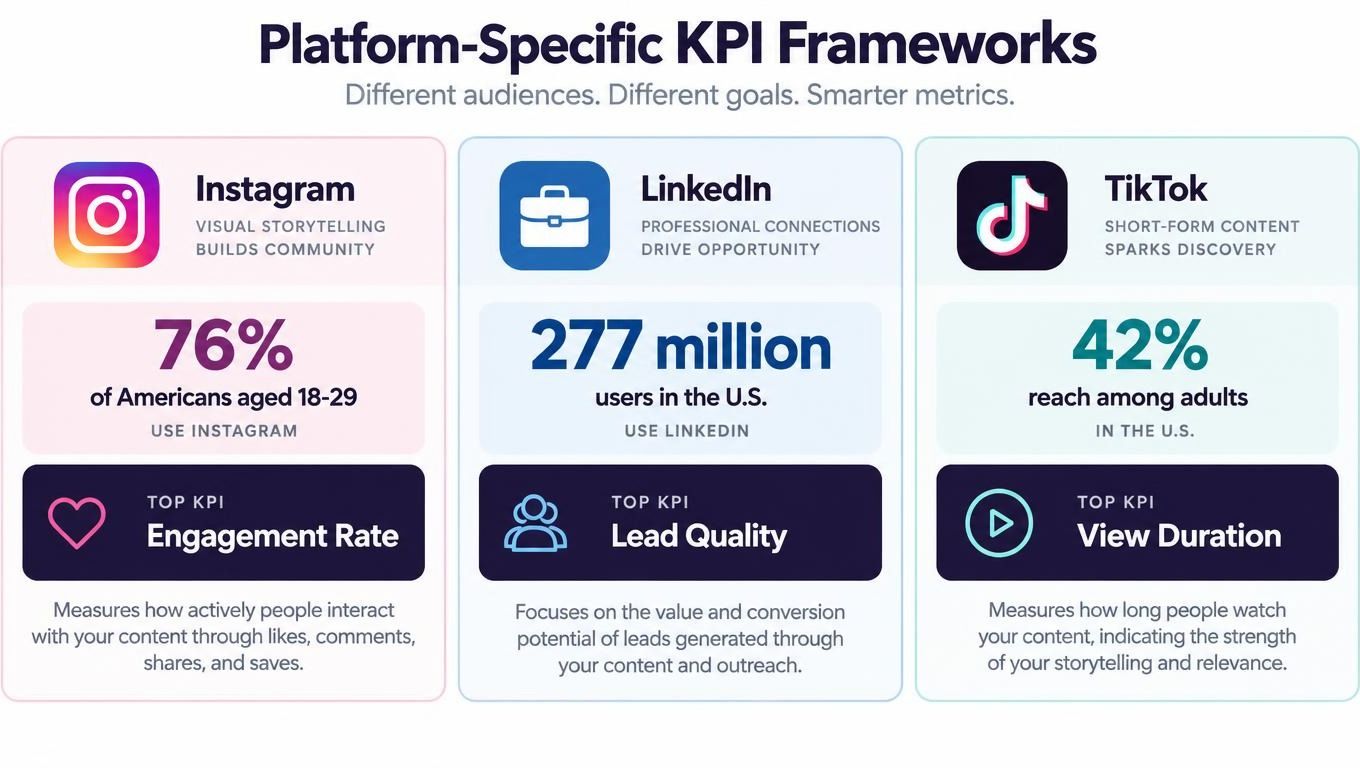
A universal engagement benchmark makes cross-platform reporting look tidy while hiding meaningful differences. YouTube, Facebook, Instagram, and TikTok serve different audience behaviors, formats, and maturity levels, so the same post-level result shouldn't receive the same interpretation everywhere.
Pew Research Center's 2023 survey of 5,733 American adults found that 83% had ever used YouTube, 68% had used Facebook, and 47% had used Instagram. Pinterest, TikTok, LinkedIn, WhatsApp, and Snapchat each reached between 27% and 35% of U.S. adults. TikTok rose from 21% of U.S. adults in 2021 to 33% in 2023, while Facebook remained broadly flat at 68%. Pew Research Center's social media usage findings
Those figures are a U.S. reference point, not a global audience model. They show why a newer network can produce faster relative growth from a smaller base, while an established network may deliver greater absolute reach with slower growth.
Match the KPI to the job
| Platform context | Useful primary lens | Diagnostic questions |
|---|---|---|
| YouTube | Watch quality and qualified traffic | Do viewers continue through the video, and do they take the intended next step? |
| Reach, meaningful interaction, and traffic | Is distribution reaching the intended audience, or only an existing follower base? | |
| Format-level engagement and saves | Which creative formats generate useful actions rather than passive reactions? | |
| TikTok | View quality, completion, and audience response | Does attention persist long enough to support the campaign objective? |
| Lead quality and assisted demand | Do social responses become relevant conversations or sales opportunities? |
Normalize comparisons by platform, format, audience size, and reporting period. Compare like with like, and show both relative change and underlying counts. Before selecting a measurement stack, teams can use guidance on how to choose the right analytics platform, especially when native dashboards, web analytics, CRM data, and exports need to coexist.
Content labels make the analysis more useful. Grouping posts into product education, customer proof, founder perspective, recruitment, or other content pillars helps explain why a platform performed, rather than merely ranking channels by totals.
Data Collection and Deduplication Workflows
Raw exports are working material, not a finished dataset. Before opening a visualization tool, create a controlled staging process that preserves the source files and records every transformation.
Start with a file register. Record the platform, account, export date, reporting period, time zone, paid or organic status, campaign name, and file owner. Keep the original CSV unchanged, then work from a cleaned copy. This gives the team a reference point when a stakeholder challenges a figure.
Clean the identifiers first
Standardize campaign names before joining datasets. “Spring Launch,” “spring-launch,” and “Spring launch paid” may refer to related activity, but they shouldn't be merged without review. Create a controlled campaign key and retain the original label in a separate field.
Reconcile timestamps next. Platform exports may use account time, viewer time, or UTC, while CRM and website analytics can use another convention. Choose one reporting time zone, document it, and apply it consistently to post dates, ad exposure, sessions, leads, and conversions.
Then check the post-level grain:
- Remove duplicate records: Match on post ID where available, and use account, timestamp, caption, and asset checks when IDs are absent.
- Separate distribution types: Don't combine paid and organic results unless the report explicitly labels the combined view.
- Preserve raw numerators: Keep impressions, reach, engagements, clicks, and conversions as counts before calculating rates.
- Validate campaign fields: Confirm that UTMs, landing pages, creative names, and campaign keys agree across the platform export and analytics system.
UTM discipline matters because the click source is often the bridge between social activity and site behavior. Use stable naming for source, medium, campaign, content, and term, and define how redirects, shortened links, and dark social referrals will be handled.
A repeatable dashboard should expose data lineage, not hide it. The Social Search dashboard approach offers a useful reference for thinking about pipelines, source tables, and reporting layers. For automated transfers, document the trigger, field mapping, failure handling, and destination when using iHatePosting integrations with Zapier, Make, and n8n.
Attribution Transparency and Confidence Levels
The most dangerous sentence in a social report is “this campaign generated the sale” when the evidence only shows that a platform recorded a conversion after exposure or a click. Attribution is a credit-allocation rule. Causation is a claim about what changed because of the activity. Those aren't interchangeable.
Last-click, view-through, and multi-touch models only observe behavior inside their tracking environments. Several platforms can claim the same conversion, while dark social, cross-device journeys, offline purchases, cookie loss, and incomplete referral data obscure the path.

Build a confidence ladder
A defensible report combines daily platform reporting with consistent UTMs, deduplicated conversion events, CRM reconciliation, and periodic incrementality testing. Geo-split or holdout experiments can estimate whether an exposed audience behaved differently from a comparable unexposed audience, although the design and limitations must be recorded.
Use a confidence label beside major conclusions:
- High confidence: The conversion is deduplicated, reconciled to a business system, and supported by a credible experiment or strong matching design.
- Moderate confidence: Tracking connects the source to the conversion, but cross-device, offline, or overlapping exposure limits causal certainty.
- Directional: The signal is useful for planning, but missing identifiers or platform-only reporting prevents reliable commercial attribution.
Reporting rule: Show attributed conversions and incremental lift as separate fields. Never turn a platform claim into a single inflated ROI number.
The KPI ladder should move from distribution to quality engagement, traffic and leads, then revenue or retention. Reach, follower growth, and engagement rate can diagnose awareness and reaction, but they shouldn't stand alone as proof of business value. A practical comparison of reporting suites, including Metricool and Hootsuite, should therefore consider export control, metric definitions, campaign labeling, and CRM reconciliation, not only dashboard appearance.
When randomization isn't possible, triangulate platform attribution, analytics-assisted conversions, survey recall, and pre/post or matched-market comparisons. State the exposure window, audience definition, conversion window, spend, exclusions, and known bias beside the conclusion. Stakeholders trust a bounded answer more than false precision.
Deriving Timing and Content Recommendations
A report earns its place in the operating rhythm when it changes what the team publishes next. The recommendation shouldn't be “post more video” or “publish at the best time.” It should identify the audience, content pattern, timing window, expected behavior, and measurement condition.
Start with account-derived evidence. Compare posts by local publishing time, format, audience segment, campaign, and content pillar. Use enough historical context to avoid mistaking one unusual post for a repeatable pattern, then inspect whether the result persists across related creative rather than relying on one top-ranking item.
Turn patterns into tests
A useful recommendation has five parts:
- Observed pattern: State what happened, such as product education posts receiving more saves than announcement posts.
- Likely explanation: Offer a hypothesis, not a fact. The audience may find instructional material more useful in a planning context.
- Operational change: Specify the format, publishing window, caption treatment, or distribution choice to test.
- Owner and timing: Assign the change to the content or channel owner and place it on the calendar.
- Success measure: Name the primary KPI and the diagnostic signals that would support or challenge the hypothesis.
Timing should come from the account's own performance, not generic industry averages. A best-time heatmap can reveal when an audience is active, but activity alone doesn't establish that publishing then improves qualified traffic or leads. Compare timing with content type and distribution so the team doesn't credit the clock for a creative effect.
For Instagram video, the best time to post Instagram Reels can be treated as a testing question rather than a universal answer. Keep the reporting period, audience, format, and objective stable enough to make the comparison useful, and record failed tests alongside successful ones. Audit readiness includes the decisions that didn't work.
From Data Collector to Strategic Advisor
The role changes when the report stops treating social activity as a collection of platform totals. A data collector exports numbers. A strategic advisor explains which numbers can be trusted, what they mean, what they don't prove, and which decision follows.
Consider a campaign review where TikTok produces strong view volume, LinkedIn generates fewer interactions, and the CRM records qualified conversations from both channels. A weak report ranks the platforms by visible engagement and recommends more investment in the apparent winner. A stronger report separates attention efficiency from revenue efficiency, checks whether the CRM events are deduplicated, and labels the evidence according to attribution confidence.
That distinction can change the recommendation. High-volume content may be valuable for discovery, while lower-volume content may support consideration or assist a conversion. The commercial question isn't which post looked most popular. It's which role each content type played, how confidently the team can observe that role, and whether the next test can improve the evidence.
Make the report useful to different readers
Executives need the decision, the outcome, the uncertainty, and the requested action. Channel managers need post-level patterns, timing, creative formats, and audience segments. Finance and operations teams need definitions, source files, reconciliation rules, and an explanation of how reported conversions relate to actual records.
A strong final page can contain:
- Decision: What should change in budget, content, targeting, or measurement?
- Evidence: Which normalized metrics support the recommendation?
- Limitations: Which journeys or platforms remain partially observed?
- Action owner: Who will implement the change?
- Review condition: What result will confirm, revise, or reject the hypothesis?
iHatePosting provides per-platform analytics, trends, a 12-month history, CSV export, best-time recommendations based on account data, and campaign organization across its scheduling workflow. Those capabilities can support the operational side of a defensible process, but the team still needs to define KPIs, reconcile business outcomes, and document attribution rules.
The result is more than a cleaner dashboard. It gives marketing a defensible measurement chain that can survive questions from leadership, finance, sales, and clients. Once you can distinguish observed attention from commercial evidence, your social media analytics report becomes a decision system, and your role moves from reporting activity to advising the business.
If your social reporting is scattered across platform exports, campaign calendars, and CRM records, use iHatePosting to organize publishing, campaign labels, account-level analytics, and CSV exports in one workflow. Start with a clean campaign structure, document your measurement rules, and build the next report so every important number has a traceable source.