Social Media Analytics Dashboard: What to Track
17 min readsocial media analytics dashboardengagement metricschannel analyticspost performance

DataReportal's historical series reports worldwide social media user identities rose from just under 2.27 billion in October 2015 to 5.66 billion in October 2025, equal to 68.7% of people worldwide, in the DataReportal Digital 2026 Global Overview Report. That's nearly 3.4 billion additional identities in roughly a decade. Those are identities, not an exact count of unique people, and that distinction matters. A social media analytics dashboard only helps when you know exactly what each number counts, how confident you should be in it, and what decision it can safely change.
Table of Contents
- Why Scattered App Stats Mislead
- Dashboard Components and What Each One Answers
- Metrics a Dashboard Should Keep Apart
- Channel Rollups Versus Post Records
- Engagement Rates That Are Not One Score
- From Visibility to Leads and Sales
- Turn a Monthly Read Into a Content Plan
Why Scattered App Stats Mislead
Say a small bakery checks Instagram on Monday, LinkedIn on Tuesday, and TikTok and X whenever someone remembers. Each app shows a different date range, a different definition of a view, and a different slice of the same launch. Reading them separately is like checking separate indoor thermometers in different rooms and calling the result the weather. You get readings, but you don't get a shared picture.
The scale explains why those readings drift apart so easily. By April 2026, global activity had reached 5.79 billion user identities, representing 69.9% of the world's population, after rising by 294 million identities, or 5.4%, during the preceding year, according to the social media users worldwide dataset. The same figures put monthly social use at 94.7% of internet users, so platforms are nearly universal among people already online. Remember, identities are accounts, not unique people.
What a combined view changes
A growing global base doesn't prove your brand, campaign, or single post improved. Your reach can rise because more accounts exist, because you posted more often, or because one network pushed a format harder that week. A social media analytics dashboard helps you separate those causes by holding impressions, reach, reactions, comments, shares, and engagement rates in one place, with dated periods and consistent definitions. If you're comparing how unified views are structured, SourceLoop's cross channel analytics guide is useful context for thinking beyond single-network reports.
You'll work through the components on a dashboard screen, a metric lookup you can reuse, channel versus post views, why one engagement score fails, a confidence ranking from visibility to sales, and a monthly planning routine. The skill to leave with is simple and practical. You should be able to tell a directional number, which suggests what to test next, from a decision-grade number, which is solid enough to change next month's calendar.
Dashboard Components and What Each One Answers
Start at the top of the screen. A usable dashboard puts a date range with a labeled reporting window first, followed by a platform or account filter and a switch between channel and post views. Without those three controls, every number below them floats. You can't tell whether you're looking at seven days or ninety, one account or five, a whole channel or a single post.
The widgets and their jobs
- KPI cards: These show impressions, reach, reactions, comments, shares, and engagement rate, each with its formula visible, and they answer what happened in the window.
- Trend lines: These track follower count and reach across the month and answer whether the account is moving, not just spiking once.
- Format-mix bar: This shows the share of video, carousel, image, and text posts, so you can see whether results reflect a format change or just more posting.
- Post table: Sorted by impressions, with an engagement split for each post, this answers which post to diagnose first.
- Audience panel: This shows segments where the platform allows it, so you can check who responded rather than only how many did.
If you're weighing layout choices against business outcomes, the marketing dashboard guidance from Cometly frames that ROI side well. For a spreadsheet starting point, social analytics templates with trend charts can mirror the same structure.
Add a data-status strip showing last retrieval time, source platform, and API version. That strip makes a stale number visible before anyone quotes it in a meeting. Treat any widget with no visible denominator or date window as decoration rather than measurement, and check every component for both before you trust it.
Metrics a Dashboard Should Keep Apart
Keep this lookup beside the dashboard until reading it feels automatic, especially when you track the right social reporting KPIs across more than one account.
Core dashboard metrics and how to read them
| Metric | What it counts | Formula or grain | How to read it |
|---|---|---|---|
| Impressions | Times a post appears on a screen | Display count | 100 people seeing a post twice equals 200 impressions |
| Reach | Individuals who saw the post | Unique viewers | The same example has a reach of 100, not 200 |
| Engagement rate | Interaction efficiency among exposures | Engagements divided by impressions, times 100 | A rate, not a volume; label the denominator |
| Engagement per follower | Response against the account base | Engagements divided by followers | Can look weak or strong because of inactive followers |
| Conversation rate | Commenting | Comments divided by the chosen denominator | Measures talk, not applause |
| Amplification rate | Sharing or reposting | Shares divided by the chosen denominator | Measures distribution effort, which differs by network |
| Applause rate | Positive reactions such as likes | Reactions divided by the chosen denominator | A light action; do not treat it as a lead |
The 100-person example
The University of Houston social media analytics guidance defines impressions as the number of times a post appears on a screen and reach as the number of individuals who saw it. So if 100 people each see a post twice, you record 200 impressions and 100 reach. Those aren't competing versions of the same thing. Impressions tell you frequency, reach tells you audience size, and confusing them makes a small, heavily re-served audience look twice as large as it is.
The same guidance gives engagement rate as total engagements divided by total impressions, multiplied by 100. Write that formula next to the card. A rate without a labeled denominator invites false comparisons, because the same post produces three different answers depending on what you divide by.
Three denominators, three meanings
- Per impression: This approximates response among people who saw the post, including repeats.
- Per reach: This measures response per unique viewer, which suits questions about how much of the exposed audience acted.
- Per follower: This measures response against the whole account base, and inactive or non-target followers can drag it down even when exposed viewers responded well.
None of these is the correct one in isolation. The right choice matches your question. Testing whether a hook worked on viewers points to per impression. Judging whether followers still care points to per follower, with caution.
Separate exposure from behavior
A practical dashboard keeps four classes apart. Raw counts record volume, normalized rates make posts comparable, a small metric set prevents one number from hiding the pattern, and qualitative notes capture comment themes that counts miss. Within that, keep exposure, shown by impressions and reach, separate from behavior, shown by comments, shares, and reactions. Exposure tells you distribution worked. Behavior tells you what people did next.
That's why the three rates in the table matter. Conversation rate reflects commenting, amplification rate reflects sharing, and applause rate reflects positive reactions. A like, a share, and a view don't cost the viewer the same effort, and they don't mean the same thing on every network. Show the formula, time window, aggregation level, and source platform on every KPI, and never add metrics whose API definitions differ just to get a bigger total.
Practical rule: Pick one denominator per report and keep it for the whole month, or your month-to-month trend is measuring your math change, not your content.
Channel Rollups Versus Post Records
Use a filing cabinet to keep the grains straight. The channel is the drawer, the post is one folder inside it, and a member or audience slice is a label on that folder. You open the drawer to see overall condition. You pull a folder when something specific needs explaining. Most misreads happen when someone answers a folder question with drawer data, or treats one folder as proof about the whole drawer.
The grouping below shows how those levels stack before you start diagnosing anything.
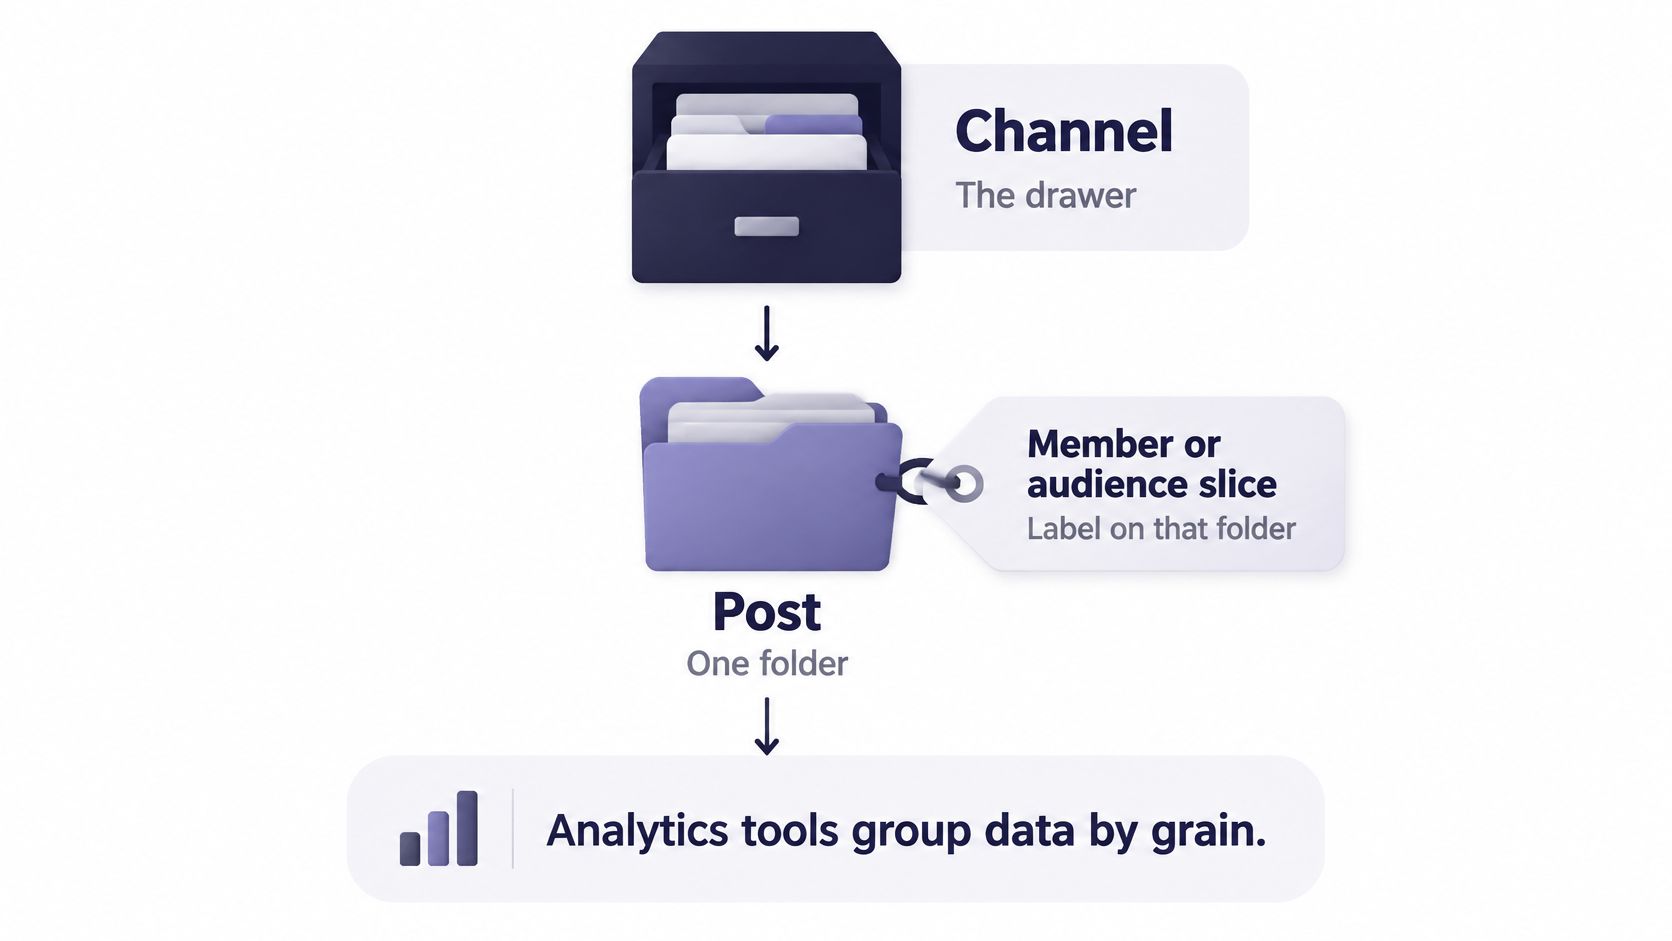
A review of social media analytics tools found four recurring metric groups, reach, audience analysis, aggregate activity, and engagement, and identified page-level, post-level, and member-level reporting as distinct use cases. In practice, treat each post as a fixed record tied to channel, account, campaign, publish time, format, and audience segment. That record shouldn't rewrite itself when you change a filter.
Channel view versus post record
| Grain | Question it answers | Typical fields | Common misread |
|---|---|---|---|
| Channel rollup | Is the account growing and posting consistently? | Followers, reach trend, posting frequency, format mix | Reach growth hides a weak launch post |
| Post record | Why did this post or campaign perform as it did? | Impressions, unique reach, reactions, comments, shares, campaign ID | One viral post is read as a channel trend |
| Member or audience slice | Which segment responded? | Segment label, format, publish time | Small slices look decisive across few posts |
What each grain is for
A channel rollup suits trend questions. Is the follower count moving over a labeled month? Did posting frequency slip? Did the mix shift toward video, which might explain a reach change without any improvement in writing? When you're choosing Instagram formats for client campaigns, that rollup tells you whether a format bet is becoming your normal output or staying an experiment.
A post record suits diagnosis. Say a launch post gets low impressions but a healthy engagement rate. Distribution failed, while people who saw it responded, so you fix timing, format, or seeding before rewriting the message. Now flip it. Impressions are high and the rate fell, so distribution worked and the creative or offer failed after exposure. Those two problems need opposite fixes, and a channel average hides both.
Keep separate fields for impressions, unique reach, reactions, comments, and shares. Don't sum a TikTok view with a LinkedIn impression to build a grand total, because the underlying events aren't the same unit. Expect data-quality labels too, including retrieval time, attribution window, and which API version supplied the number. Without them, you can't tell a real dip from a late data pull.
Here's a worked contrast. Suppose a channel is up 20 percent in reach for the month, yet three launch posts show falling comment rates. The account grew and the launch message didn't land. Those statements can both be true. Diagnose the posts before you change the whole channel calendar, since the drawer looks healthy while one set of folders is failing.
Engagement Rates That Are Not One Score
The common mistake goes like this. You sort the month by one blended engagement score, spot the top post, and make more of whatever ranked first. It's fast, it's tidy, and it assumes every action your audience took means the same thing. It doesn't.
Notice the difference between a single score on one screen and the split of actions behind it on another.

A systematic review of social media engagement metrics identifies four metric classes, raw quantitative measures, normalized indexes, metric sets, and qualitative measures, and distinguishes conversation rate, amplification rate, and applause rate for commenting, sharing, and positive reactions. Read those three separately rather than averaging them into a grade. Comments ask for a reply and can carry questions, objections, or buying signals. Shares move a post to new people. Reactions are applause that usually costs the viewer the least effort.
Why the split changes the decision
Context decides which action deserves weight. A save or a long watch can matter more for a tutorial than a like, because the viewer kept the material to use. A complaint comment still counts as engagement in a raw total, yet nobody should celebrate it or repeat the post that caused it. A blended score treats both as fuel.
Units also refuse to line up across networks. A TikTok view, an Instagram like, and an X repost aren't interchangeable, since the effort and intent behind each one differ. Compare normalized rates inside one network first. Compare across networks only when denominators match and you state plainly that the actions themselves still aren't equivalent.
The short walkthrough below shows how that reading order works on a live post before you apply it to your own table.
Show the formula, the window, the grain, and the network, or the number is not ready to steer a plan.
A three-line reading order
- Check exposure first. Look at impressions and reach to see whether distribution worked at all.
- Compare the split. Set conversation, amplification, and applause rates against the account's own prior posts, not against a stranger's benchmark.
- Skim the actual comments. Look for themes, tone, and off-topic noise that the rates can't describe.
Finish with this test case. A post scores high, but the comments are angry or off-topic. That isn't a win, and it doesn't belong on your repeat list. Put it on the diagnose list, read what people said, and fix the offer, wording, or targeting before anything similar goes out again.
From Visibility to Leads and Sales
Most dashboards stop where the hard question starts. Survey reporting summarized by Social Strategy Hub on small business social media ROI indicates only 35% of small and medium-sized businesses consistently track social activity to actual sales conversions. The rest often lean on vanity metrics, so a busy month can look successful while producing no qualified business.
The funnel below maps that gap between being seen and being paid.
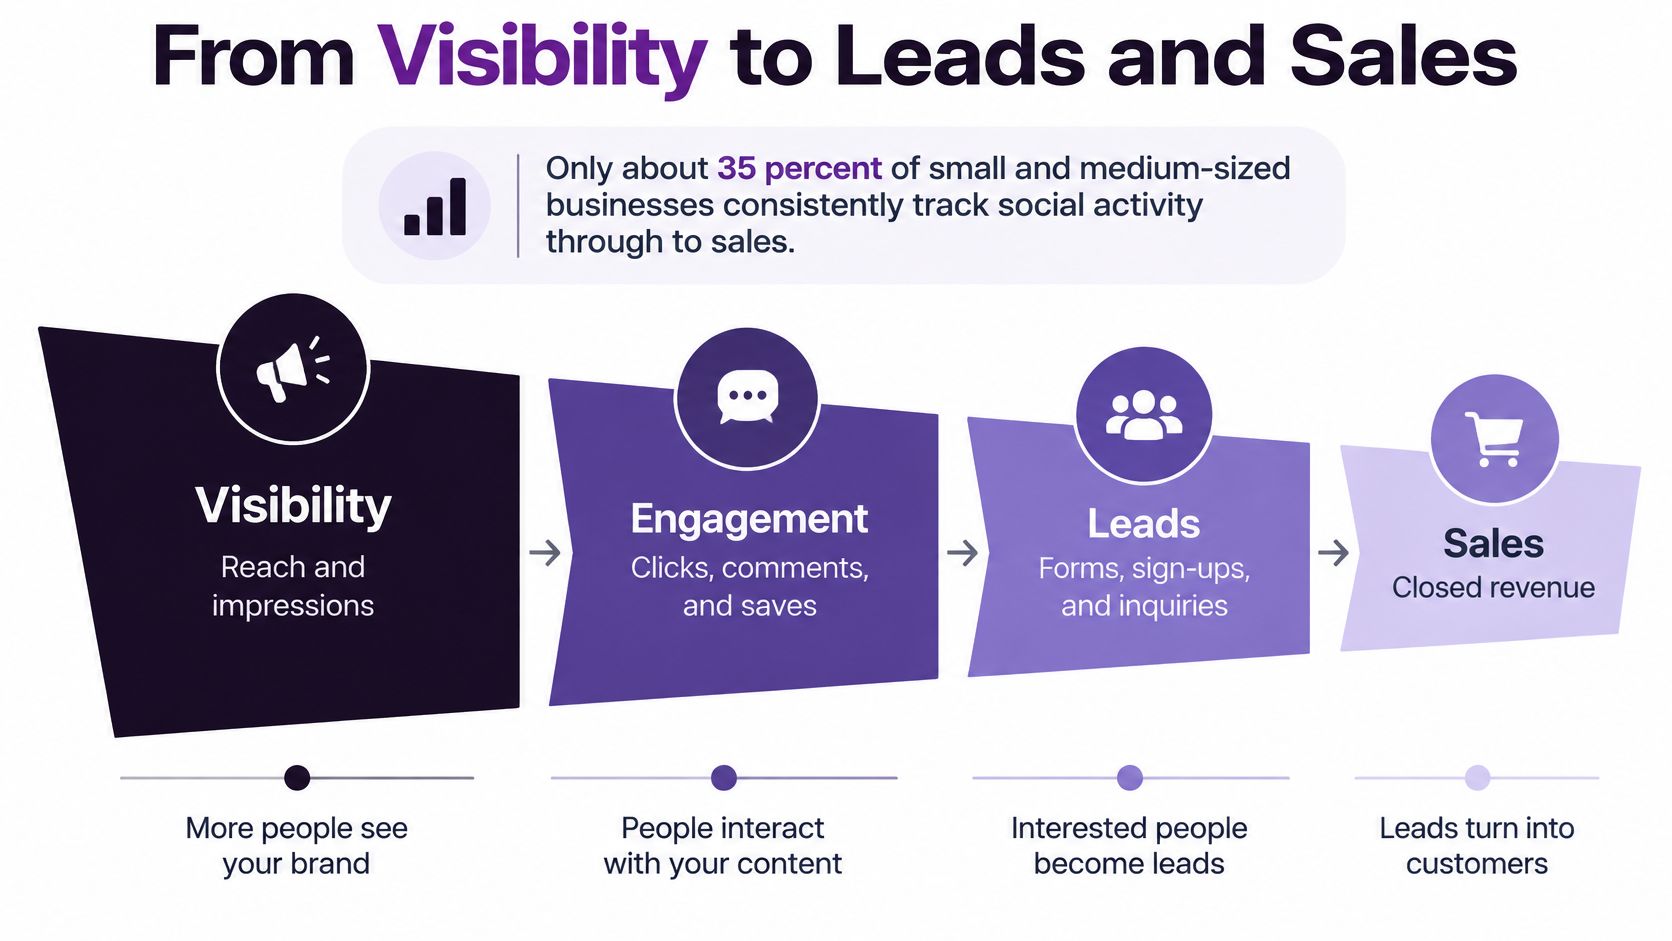
Accurate attribution doesn't mean giving every sale to one network. Customers move between social platforms, websites, messaging apps, and shop counters, and a single-credit model pretends that journey was straight. A confidence ladder is more honest, and it helps you track social KPIs that matter without overstating them.
Which dashboard signals are safe to act on
| Layer | Confidence | Example signal | Limit to show |
|---|---|---|---|
| Exposure | Directional | Impressions and reach | Shows visibility, not demand or sales |
| On-platform behavior | Directional | Comments, shares, saves, watch time | High interaction is not a qualified lead |
| Tagged clicks | Stronger | Campaign and post links into the site | Misses dark social and offline visits |
| CRM or purchase | Decision-grade when identifiers match | Leads, purchases, retention | Breaks if the tag is stripped |
| Assisted or surveyed demand | Decision-grade with uncertainty | Assisted conversions, branded search, customer say-so | Do not assign the whole sale to one network |
Building the ladder with tools you may already have
Treat native exposure and engagement as directional. Add tagged links with campaign and post identifiers for a stronger click layer you can follow into first-party site analytics. When that same identifier survives into CRM outcomes, leads and purchases become decision-grade. For demand that never clicks, use customer surveys plus branded-search and post-exposure comparisons, and show assisted conversions as shared credit. If you want the wider funnel logic behind those stages, Blu Dragonfly's social funnel guide lays out that progression.
Make uncertainty visible on the dashboard itself. A path through a messaging app or a shop counter can't carry the same confidence as a matched CRM record, and hiding that difference leads to budget decisions built on hope.
Two conflicting cases
Say a post earns few link clicks but branded search lifts clearly afterward. That's discovery working, not a failed advertisement, because people remembered the name and searched later on their own timing. Record it as assisted demand with uncertainty noted.
Now take a post with huge engagement and no qualified leads. You've got attention without an offer people want, or attention from the wrong audience. More of that content won't fix the mismatch.
Preserve four fields on every post so these judgments stay possible later. Keep campaign name, content pillar, destination URL, and whether a human reviewed it. Research hasn't confirmed many proposed engagement metrics as business results, and engagement combines cognitive, emotional, and behavioral parts a native dashboard can't fully observe. A high interaction count is evidence of attention, not of an outcome. Connect platform metrics to clicks, leads, conversions, or retention only through explicit attribution rules.
Change budget or offer only on decision-grade rows. Use directional rows to choose what to test, not what to scale.
Turn a Monthly Read Into a Content Plan
A monthly read works when it follows the same order every time. If you start with whichever post caught your eye, you'll rebuild the strategy around anecdotes. If you start with locked definitions and channel trends, individual posts become evidence instead of distractions.
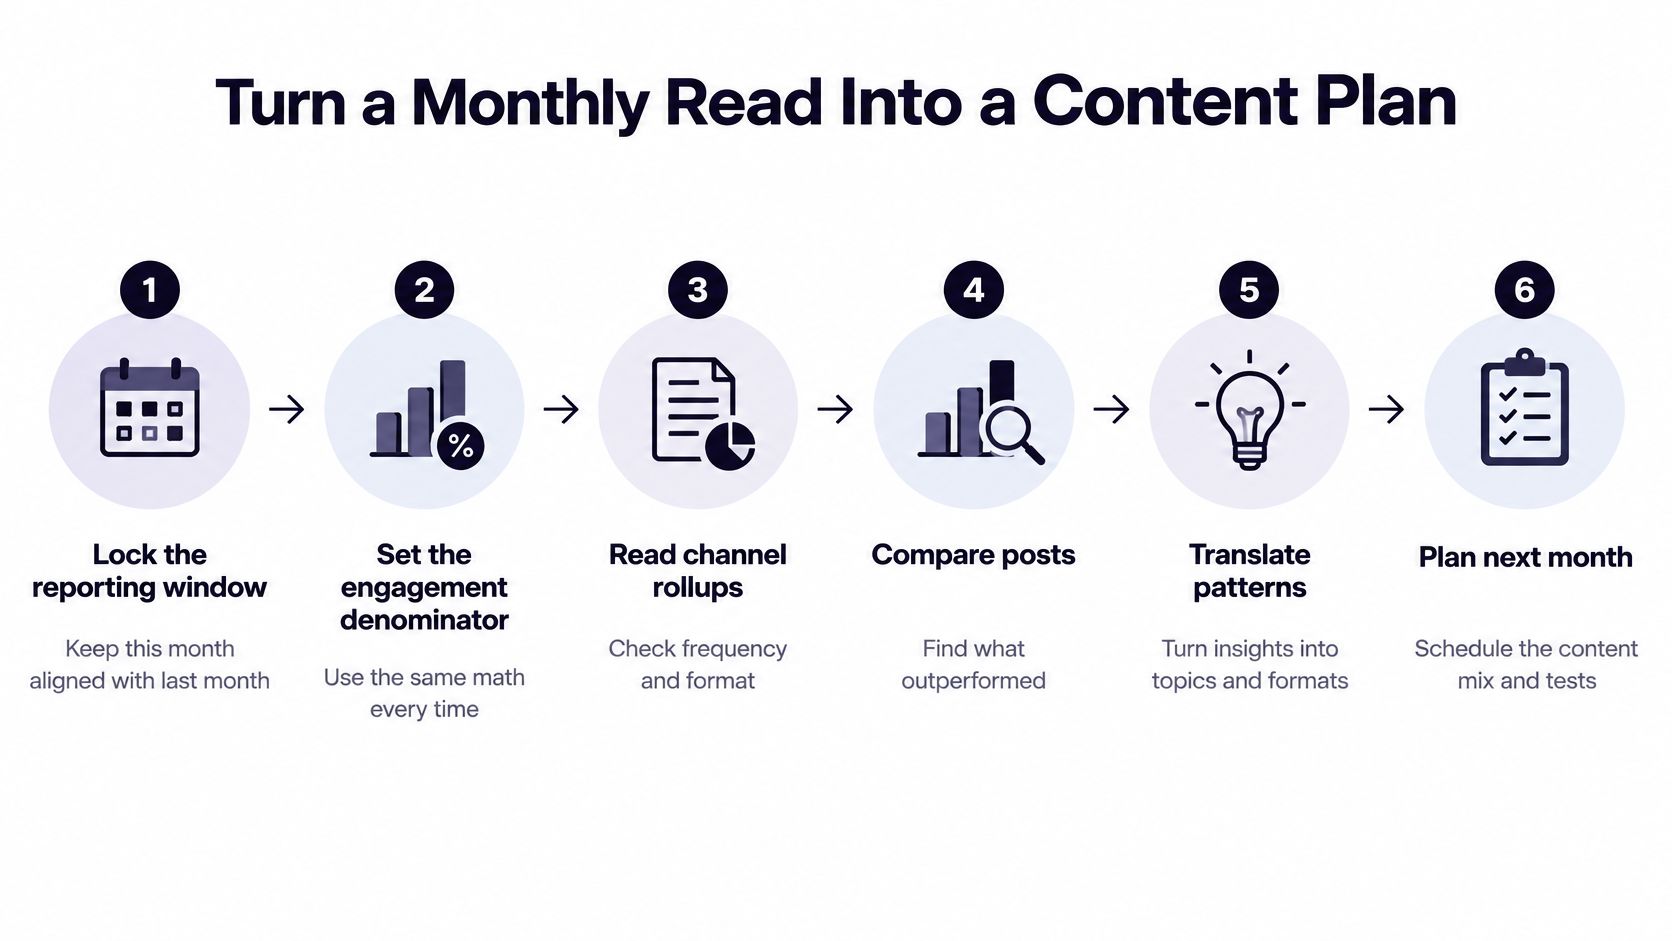
This six-step flow turns one month of results into next month's choices.
The six-step routine
- Lock the window and denominator. Fix the reporting window and engagement denominator first, so this month matches last month and any change reflects content, not arithmetic.
- Read channel rollups before posts. Check frequency, format mix, and reach trend at channel level, because a posting gap or format shift can explain results before any single caption does.
- Split posts by failure type. Divide post records into low distribution versus weak response after exposure, since the first needs timing or format work and the second needs creative or offer work.
- Mark confidence on each notable post. Label it directional or decision-grade on the ladder, and note conflicts such as strong saves with no clicks instead of smoothing them away.
- Choose one keep, one change, and one test. Repeat formats that earned useful comments or qualified clicks, fix timing where reach collapsed, and test new hooks only where evidence is directional.
- Put choices on the calendar. Place them by pillar and campaign, following iHatePosting's guide to content calendar creation, and log whether each draft was human-written, assisted, or generated so later comparisons stay fair.
Step six is where a social media analytics dashboard earns its place, with channel results and the calendar sitting together instead of in separate tools. We include video, Reels, and carousels, a visual calendar, per-platform tailoring, live previews, pre-publish checks, hashtag groups, Unsplash stock photos, and analytics with 12-month history and CSV export. We also include best-time-to-post recommendations derived from your own data, which suits step three when distribution looks weak.
Producing next month's posts without losing the evidence
Once a winning pattern is clear, AI-powered generation can draft captions, hooks, hashtags, images, and short videos suited to each platform, which clears creative blockages and cuts manual drafting time. AI agents can then handle adaptation, scheduling, and publishing across networks, reducing repetitive work and fragmented handoffs. Keep a person checking anything customer-facing before it goes live. Speed is useful only if the post record still shows its campaign, pillar, destination, and review status, so next month's read can judge it fairly.
Three choices to write down
- One denominator and date window kept unchanged for the next comparison, written where the whole team can see it.
- Offer, landing page, or spend changes made only on decision-grade rows, with directional rows reserved for tests.
- The next audit date, scheduled monthly, quarterly, or after a major campaign, which is the cadence we recommend.
Write down the keep, the change, and the test before you open another network app. That single page is the point of the whole read. The dashboard supplied the evidence, the confidence ladder set its weight, and your three choices turn both into a calendar you can defend next month.
Stop juggling separate network apps and bring your channel results, post records, and visual calendar together so every monthly keep, change, and test rests on evidence you can trace. With iHatePosting, you can plan, create, adapt, and publish across your channels from one workspace, with analytics history kept beside the schedule. Visit today, connect your accounts, and run your next monthly read from numbers that show their formula, window, and confidence.