Social Media Analytics for Business: KPIs That Matter
13 min readsocial media analyticsbusiness KPIscontent strategymarketing analytics
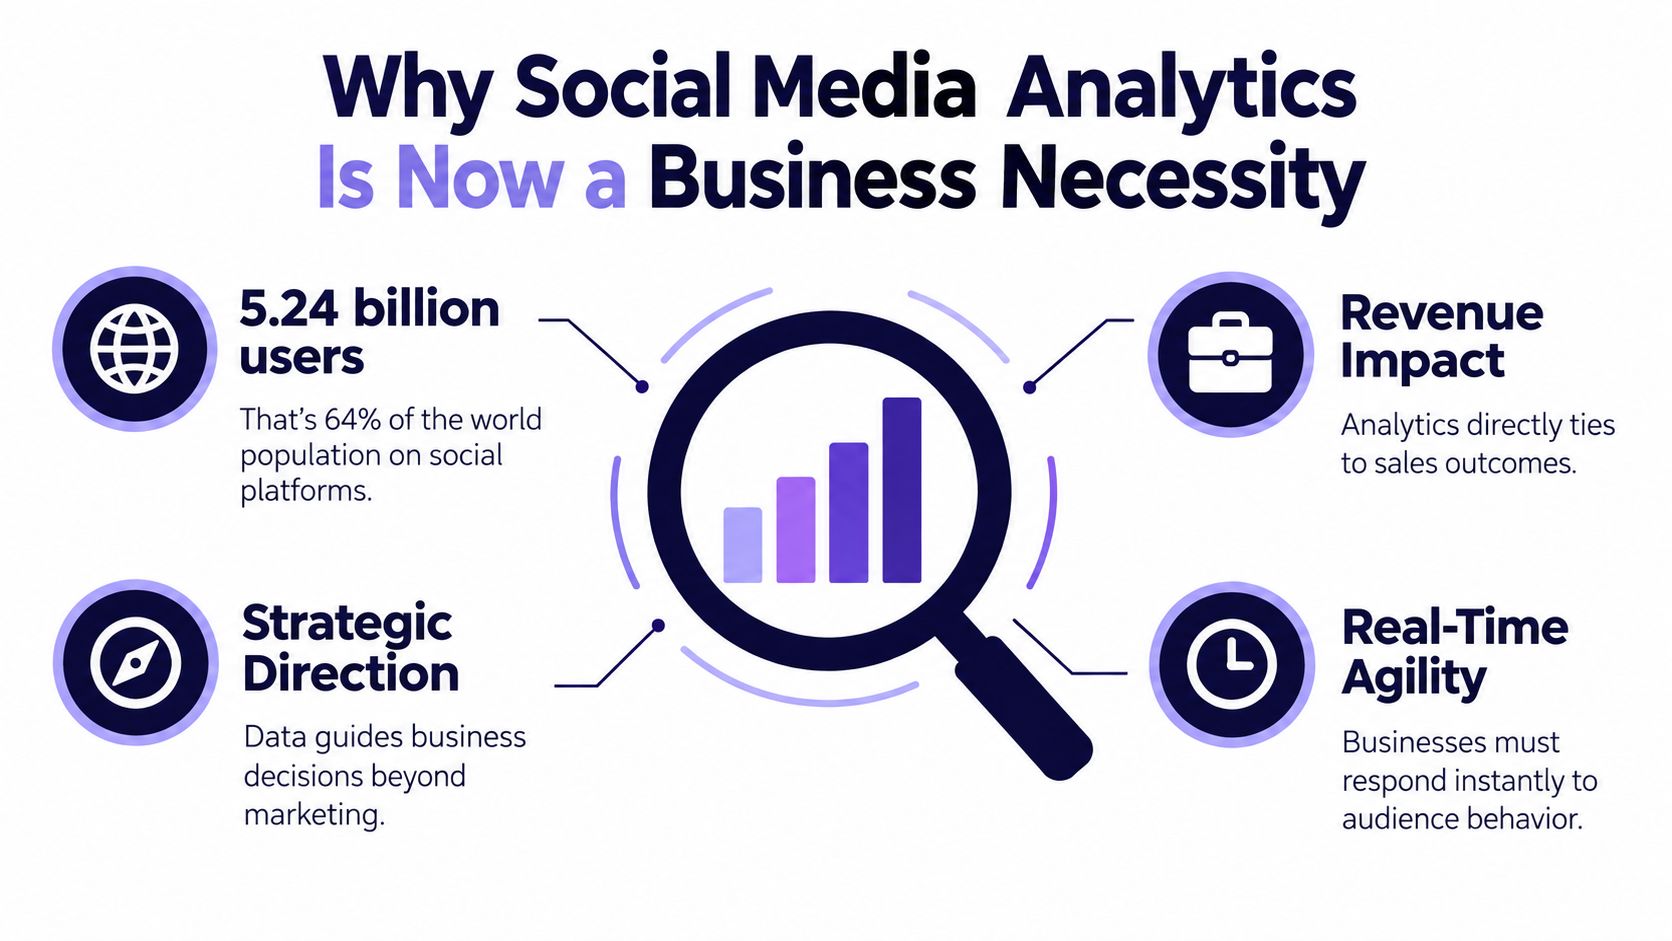
By early 2025, 5.24 billion social media user identities existed worldwide, equal to 63.9% of the global population DataReportal Digital 2025. That scale changes the job. Social media isn't a place where businesses “post and hope” anymore, it's a measurable environment where teams need to separate distribution, engagement, and business impact before they can make a sane decision.
Table of Contents
- Why Social Media Analytics Is Now a Business Necessity
- What Social Media Analytics Actually Means for a Business
- The Business KPIs That Actually Move Decisions
- Reading Trends Without Misreading the Story
- Turning Analytics Into Scheduling and Content Strategy
- Why Engagement Alone Is Not Enough to Prove Value
- A Practical 30-Day Analytics Routine for Any Team
Why Social Media Analytics Is Now a Business Necessity
When a channel reaches that many people, the next question is how to measure what happens after the post goes live. DataReportal's early-2025 analysis found that the average social media user actively used 6.83 platforms per month, so attention is fragmented by design, not by accident DataReportal social media users. If one person can meet your brand on several networks in a single week, a single-platform view will miss part of the story.
Brand discovery now happens inside social feeds
Follower counts only show part of the picture. Surveyed adult social-media users said they visit social platforms to learn about brands and the content they publish, and that behavior was especially common on Instagram, Facebook, and TikTok. Social media analytics for business therefore works as a discovery discipline. It shows how people move from noticing a brand to checking whether it deserves more attention.
That behavior changes how reports should be read. If audiences split their attention across platforms, businesses need segmented analysis by network, not one blended average that hides differences. A post can perform well on one platform and fail on another for reasons that have nothing to do with the idea itself, just the audience context and the distribution pattern.
Practical rule: treat each network as a separate audience environment until the data proves otherwise.
Segmented analysis is easier when publishing is organized per network. A workflow like iHatePosting's scheduling and planning tools keeps that structure in place, but analytics is what turns the activity into decisions. Without measurement, you are guessing which channel deserves more effort, which message lands, and which audience matters.
What Social Media Analytics Actually Means for a Business
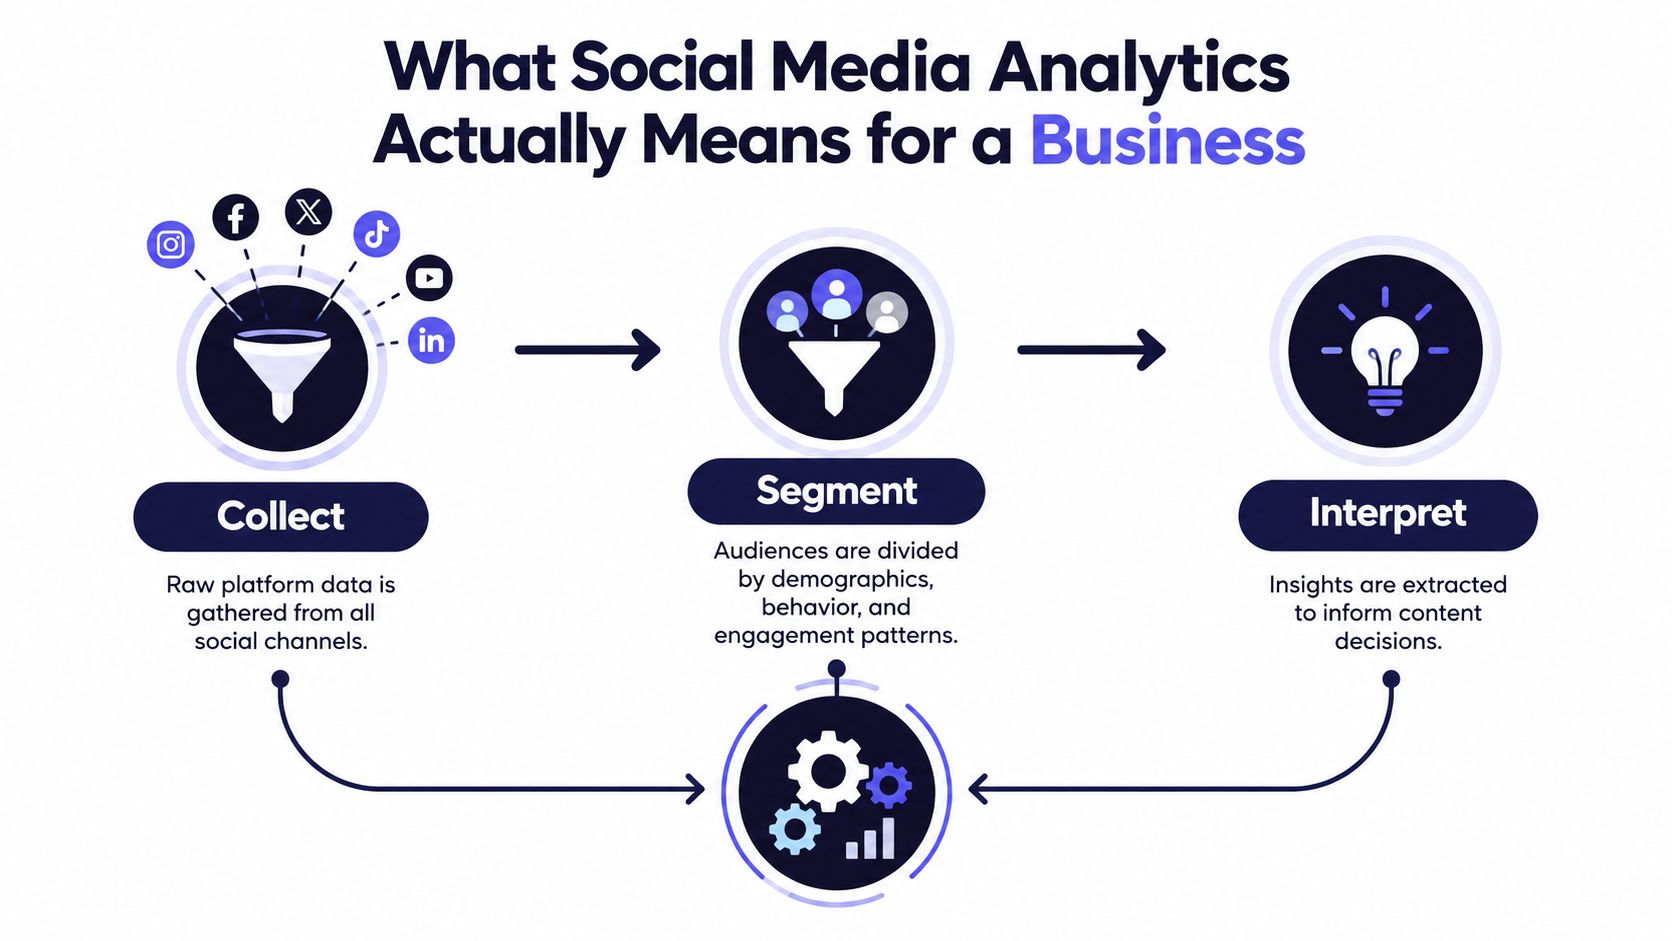
Social media analytics is the practice of collecting, segmenting, and interpreting platform data so a business can make better choices about content, timing, audience, and spend. That sounds broad because it is broad. The mistake many teams make is treating analytics as a dashboard to glance at instead of a workflow that connects raw activity to a decision.
The four metric families that matter
A useful way to read any report is to separate metrics by the question they answer.
- Distribution metrics answer, “Did people get a chance to see this?” Reach and impressions live here.
- Interaction metrics answer, “Did the audience respond?” Engagement rate, saves, shares, and similar actions belong here.
- Outcome metrics answer, “Did the post move someone closer to business value?” Clicks, sign-ups, and conversions fit this group.
- Business impact metrics answer, “Did social contribute to revenue or retention?” Attribution, assisted revenue, and cohort behavior matter here.
That separation sounds simple, but it solves a common reporting mess. A post can have strong reach and weak clicks, or modest reach and strong conversion behavior. Those are different stories, and they call for different fixes.
For teams that need to gather and normalize large volumes of platform data, scraping social media at scale can help with broader research and competitive monitoring, but the business value still depends on how carefully you define the metrics you compare. Collection without interpretation is just a bigger pile of numbers.
Why platform-tailored measurement matters
Engagement rate isn't one universal formula that means the same thing everywhere. A follower-based comparison can mislead you if another network uses reach or impressions as the denominator. That's why a business should define its reporting logic before it starts comparing platforms, otherwise it ends up comparing apples to fruit salad.
A clean analytics setup tells you whether you're looking at exposure, response, or outcome. Once that's clear, the next question becomes which numbers belong on the executive view.
The Business KPIs That Actually Move Decisions
Teams need fewer KPIs than they think. The point isn't tracking everything the platform gives, it's keeping numbers that change what you do next week. If a metric doesn't affect creative, timing, targeting, budget, or follow-up, it belongs in a deeper report, not the main dashboard.
The KPI set that survives a real business review
| KPI | Business Question | Definition / Formula | Common Trap |
|---|---|---|---|
| Reach | Did the content reach new or existing people? | Unique people exposed to the post | Treating high reach as proof of quality |
| Impressions | How often was the content shown? | Total times content was displayed | Counting repeat views as audience growth |
| Engagement rate | Did people respond to the content? | engagements / reach or impressions × 100 | Mixing denominators across platforms |
| Click-through rate | Did the post move people off-platform? | clicks / impressions or reach × 100 | Assuming clicks mean intent if the landing page fails |
| Conversion rate | Did the traffic complete a business action? | conversions / clicks × 100 | Blaming content for a weak checkout or form flow |
| Assisted revenue | Did social contribute along the journey? | revenue attributed through assisted paths | Ignoring touches that didn't get last-click credit |
Read the numbers in context
A high engagement rate with low follower count can still mean the message resonates. A strong CTR with poor conversion often points to a targeting or landing-page problem rather than a content problem. A post that wins on reach but loses on clicks may have broad appeal without commercial relevance.
That's why baseline thinking matters more than a raw number. The useful comparison is usually the post against the account's own median, not the account against some generic internet average. iHatePosting's analytics report guide is a useful reference if you need to turn those metrics into a repeatable report structure.
Decision rule: if a KPI doesn't change a decision, don't put it at the center of the report.
A normalized performance index helps keep things honest. One simple version is post engagement rate / account median engagement rate. It tells you whether a post beat the account's normal pattern, which is more useful than asking whether it beat a competitor with a completely different audience, budget, or format mix.
Reading Trends Without Misreading the Story
A single post can fool you. A trend line usually can't, if you read it with enough context. The best analysts use a 12-month history because it exposes seasonality, repeated format effects, and changes in distribution that don't show up in one week of numbers.

Compare against the account, not the myth of a universal benchmark
Organic reach is a good example. Recent reporting noted that Instagram organic reach rates fell to roughly 3.5% to 4%, an 18% year-over-year decline Swydo on Instagram organic metrics. That kind of shift makes old comparisons dangerous. If you judge this month against last year without adjustment, you may call a distribution problem a creative problem.
The same caution applies when platform metrics change their emphasis. Networks increasingly favor views, reach, watch time, saves, or shares in different ways, so a single engagement-rate target can hide more than it reveals. A business should annotate major algorithm changes, campaign launches, and format changes directly in its reporting notes.
A simple trend-reading habit
Write one sentence of interpretation next to every chart. Not three sentences, not a presentation paragraph, just one clear sentence that says what changed and what you think caused it. That habit forces you to separate observation from speculation.
- If reach dropped: check distribution inputs first, such as format, timing, and network changes.
- If engagement dropped: look at the creative, the audience segment, and the message match.
- If clicks dropped: inspect the offer, the call to action, and the landing page.
- If conversion dropped: audit the post-click journey before you blame the post itself.
A brief video walkthrough can help teams build that habit into their review rhythm.
The main point is simple. A lower number doesn't automatically mean worse work. Sometimes it means the platform delivered less of the audience you were trying to reach.
Turning Analytics Into Scheduling and Content Strategy
Analytics only matters if it changes the calendar. Once you know which posts beat the account baseline, the next step is to use that information to shape publishing windows, content pillars, and campaign cadence. That's where analysis turns into operational discipline.

Use your own timing data, not generic advice
A best-time-to-post recommendation is only useful if it comes from your account's own performance history. Generic “best time” charts ignore audience behavior, content mix, and platform-specific differences. Your followers are not an average internet audience, so your calendar shouldn't pretend they are.
That's where testing comes in. Publish otherwise similar posts in different windows, then compare like with like. If a post format consistently performs better on Tuesday morning than Friday afternoon for your account, that's a scheduling clue worth acting on.
A centralized workflow such as iHatePosting's content calendar tool can help teams keep those observations attached to the post itself, which matters when you're reviewing a month of work and trying to remember why one campaign outperformed another.
Retire weak formats and sharpen the pillars
Not every format deserves another round. If a carousel, video style, or caption pattern keeps landing below the account baseline, stop treating it as a core pillar just because it once looked promising. The goal is not to keep everything that gets posted, the goal is to keep what reliably produces useful attention.
A clean scheduling system should let you record:
- Campaign name, so performance doesn't get mixed with unrelated posts.
- Content pillar, so you can compare themes instead of random one-offs.
- Posting time, so timing tests stay visible.
- Network, so platform effects don't get blended together.
- Link destination, so click and conversion paths stay traceable.
Operational rule: if you can't link a post to a campaign or pillar, you'll struggle to learn from it later.
For a small team, that level of discipline is enough. You don't need a giant reporting stack to learn whether a topic deserves more budget, a different format, or a better time slot. You just need the loop to stay tight, measure, segment, decide, schedule, then measure again.
Why Engagement Alone Is Not Enough to Prove Value
Engagement is easy to count, which is why teams reach for it first. A post can win attention and still do nothing for the business, while a quieter post can bring in a lead, a sale, or a retention signal. The uncomfortable part of social media analytics for business is that the exciting numbers and the meaningful numbers are rarely the same ones.
A global survey of 1,200 marketing leaders found that 68% used engagement to define social effectiveness, while only 57% used revenue and 55% used efficiency NetInfluencer on the measurement gap. The same survey found that 56% believed social media drives revenue, yet fewer than half rated their teams as expert at measuring business impact. That gap matters because it shows how often businesses confuse activity with proof.
Lightweight attribution tools for smaller teams
You do not need a warehouse of data to measure value better. You do need a few habits that make attribution less sloppy.
- Use UTMs consistently. Every link should identify campaign, source, and content type.
- Review assisted conversions. Some posts help later in the journey without being the last click.
- Run holdout weeks. Pause a content type or campaign window and compare the result.
- Check cohorts. Compare the behavior of people exposed to social campaigns with similar groups that were not.
- Watch direct and offline signals. Social can influence purchases that never show up in a clean click path.
If you are weighing tool options for this kind of reporting, see a comparison of Metricool and Hootsuite. It helps to choose software that can keep campaign tags, post-level records, and outcome tracking visible in the same workflow.
For a related framing on attention value, calculate earned media value for operations is useful when you need to explain why a high-visibility post did not automatically create pipeline.
The practical mindset shift is simple. A viral post is not automatically a winning post. A modest post that brings qualified traffic or a real conversion can be the better business outcome, even if it looks dull on the surface.
A Practical 30-Day Analytics Routine for Any Team
A clean analytics routine is less about volume and more about discipline. It stops a team from treating every spike as a verdict and every dip as a failure. The goal is simple: separate a distribution problem from a content problem, then connect both to business outcomes.
Weekly, monthly, and campaign-end checks
Start with a weekly review. Check reach, impressions, engagement rate, and CTR on each active network, then ask what changed. If a post underperforms, the first question is whether the issue was the message, the timing, or the channel mix. That keeps the team from rewriting good content just because distribution was weak.
The monthly review should compare each network with its own rolling baseline, then compare the month with the prior campaign or a similar seasonal period. That is where slower shifts show up, like format fatigue or audience drift. Campaign-end review is where the numbers have to connect to leads, sales, retention, or another outcome the business uses. If the path is messy, separate direct conversions from assisted contribution instead of forcing everything into one bucket.
What to record every time
A reusable log keeps the next review honest. Record the campaign name, content format, posting time, network, and link destination every time you publish. If you are reviewing paid and organic together, note that too, because blended reporting can hide which side carried the result.
For a ready-made structure, our social media scheduler template gives you the log fields, campaign, format, time, network, link destination, already laid out. For teams that need a broader platform view, see OGTool's platform breakdown shows why platform choice should follow audience and outcome, not habit. Use that alongside your own history, and the calendar starts to look like a decision system, not a posting queue.
A simple rule for the month ahead
If a post beats the account baseline, repeat the pattern with one controlled change. If it misses the baseline, identify whether the problem was reach, response, or outcome before changing the creative. That one habit saves more time than a stack of reports.
iHatePosting helps teams plan, tailor, and publish across multiple networks in one workflow, with scheduling, analytics, and best-time guidance tied to account history. If you want next month's review to run on the same structure, start the 7-day free trial and keep campaign names, posting times, and performance history in one place.